How to measure a voltage without going to the lab
This is work in collaboration with
Dirk van der Marel.
The figure above with its caption, from
arXiv:2201.11883v1, shows what is claimed to be a "Measured voltage"
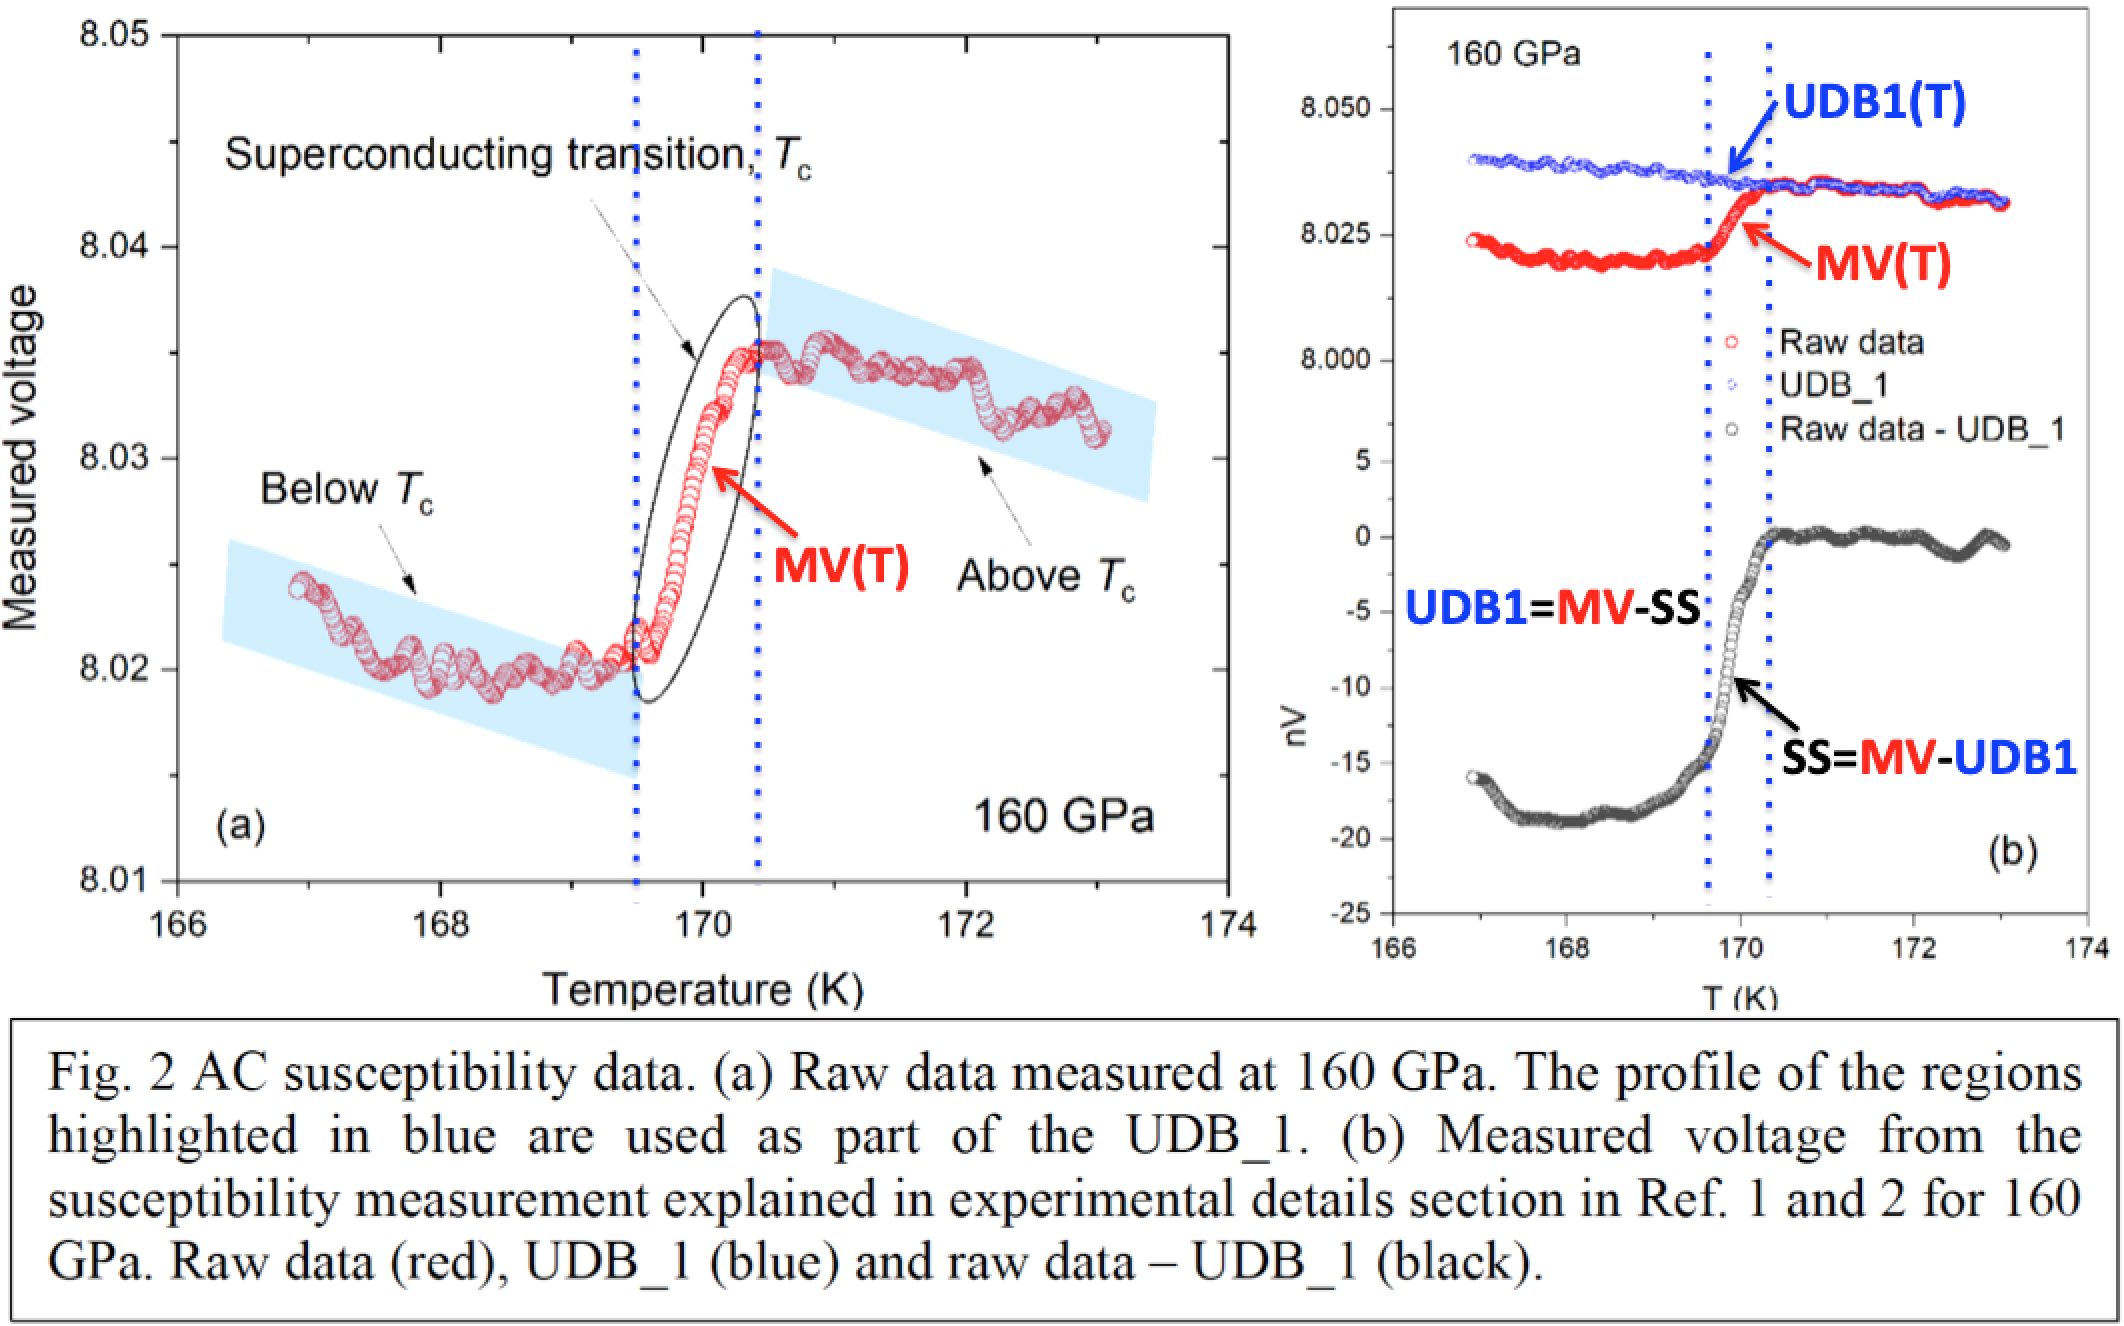
MV(T) for CSH, or "carbonaceous sulfur hydride", a material reported to be a room temperature superconductor in
Nature 586, 373 (2020).
The "Measured voltage" (red curve) changes rapidly between the vertical dotted lines, supposedly indicating a
"superconducting transition". The blue curve labeled
UDB1(T) is claimed to be a "user defined background" which, in the
transition region between the vertical dotted lines, is
supposedly independent of MV(T),
since only the "profile of the regions highlighted in blue" in the left panel were "used as part of the UDB1", as the Fig. caption explains.
In the following you will learn how to calculate MV(T)
in the transition region starting from
UDB1(T), without measuring anything.
1) Pick any line between 203 and 253 in this file:
160 GPa data, the "superconducting transition region" for that pressure,
temperature range 169.5824K to 170.2829K. That file has the numerical data given in table 5 of
arXiv:2111.15017
underlying the published susceptibility data in
Nature 586, 373 (2020), "Room-temperature superconductivity in a carbonaceous sulfur hydride".
2) Select the values for:
line #, Temperature, n(T), "Measured Voltage", "Superconducting Signal",
to be entered below.
3) Enter the values
in what follows.
Then, calculate "Non-measured Voltage" NMV(T) and compare with "Measured Voltage" MV(T)