6 months ago, Ranga Dias and Ashkan Salamat explained to the world through arXiv:2201.11883v1 how they constructed a "user defined background signal" (UDB_1) to be subtracted from the raw ac susceptibility data they had reported in arXiv:2111.15017 to obtain the "superconducting signal" published in Nature 586, 373 (2020), using the profile of the same raw data from which they would subtract. This innovative way of background subtraction, akin to a dog chasing its own tail, has not yet been fully adopted by the high pressure superconductivity community to my knowledge but is being seriously considered.
While I
(and others)
have not been able to figure out from reading and rereading
arXiv:2201.11883v1
what UDB_1 actually is and how it is constructed, we have now been
reassured by Ranga Dias
in the question/answer period after
a talk he recently gave
at
CDRTS 2022,
that all the information needed
to understand UDB_1 is indeed contained in that
arxiv paper.
The part of the Ranga Dias talk where he answers questions about UDB_1
is in the 2-minute video available by
clicking on the image below:
The reason for why this sheds clear light into the understanding of Dias and Salamat's
claim of room temperature superconductivity
is explained in this 2-minute video:
Dias decided
to not explain further, as seen in
this 1 minute video.
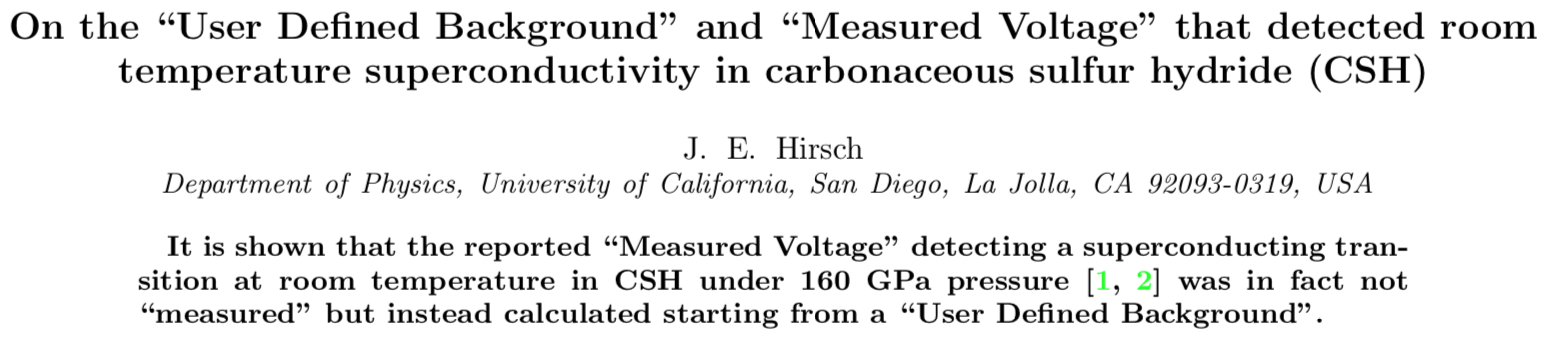
For a short detailed self-contained explanation
that sheds definitive light on these issues,
that any reader can quantitatively reproduce for him/herself,
see
a 4-page writeup by clicking on the image below:
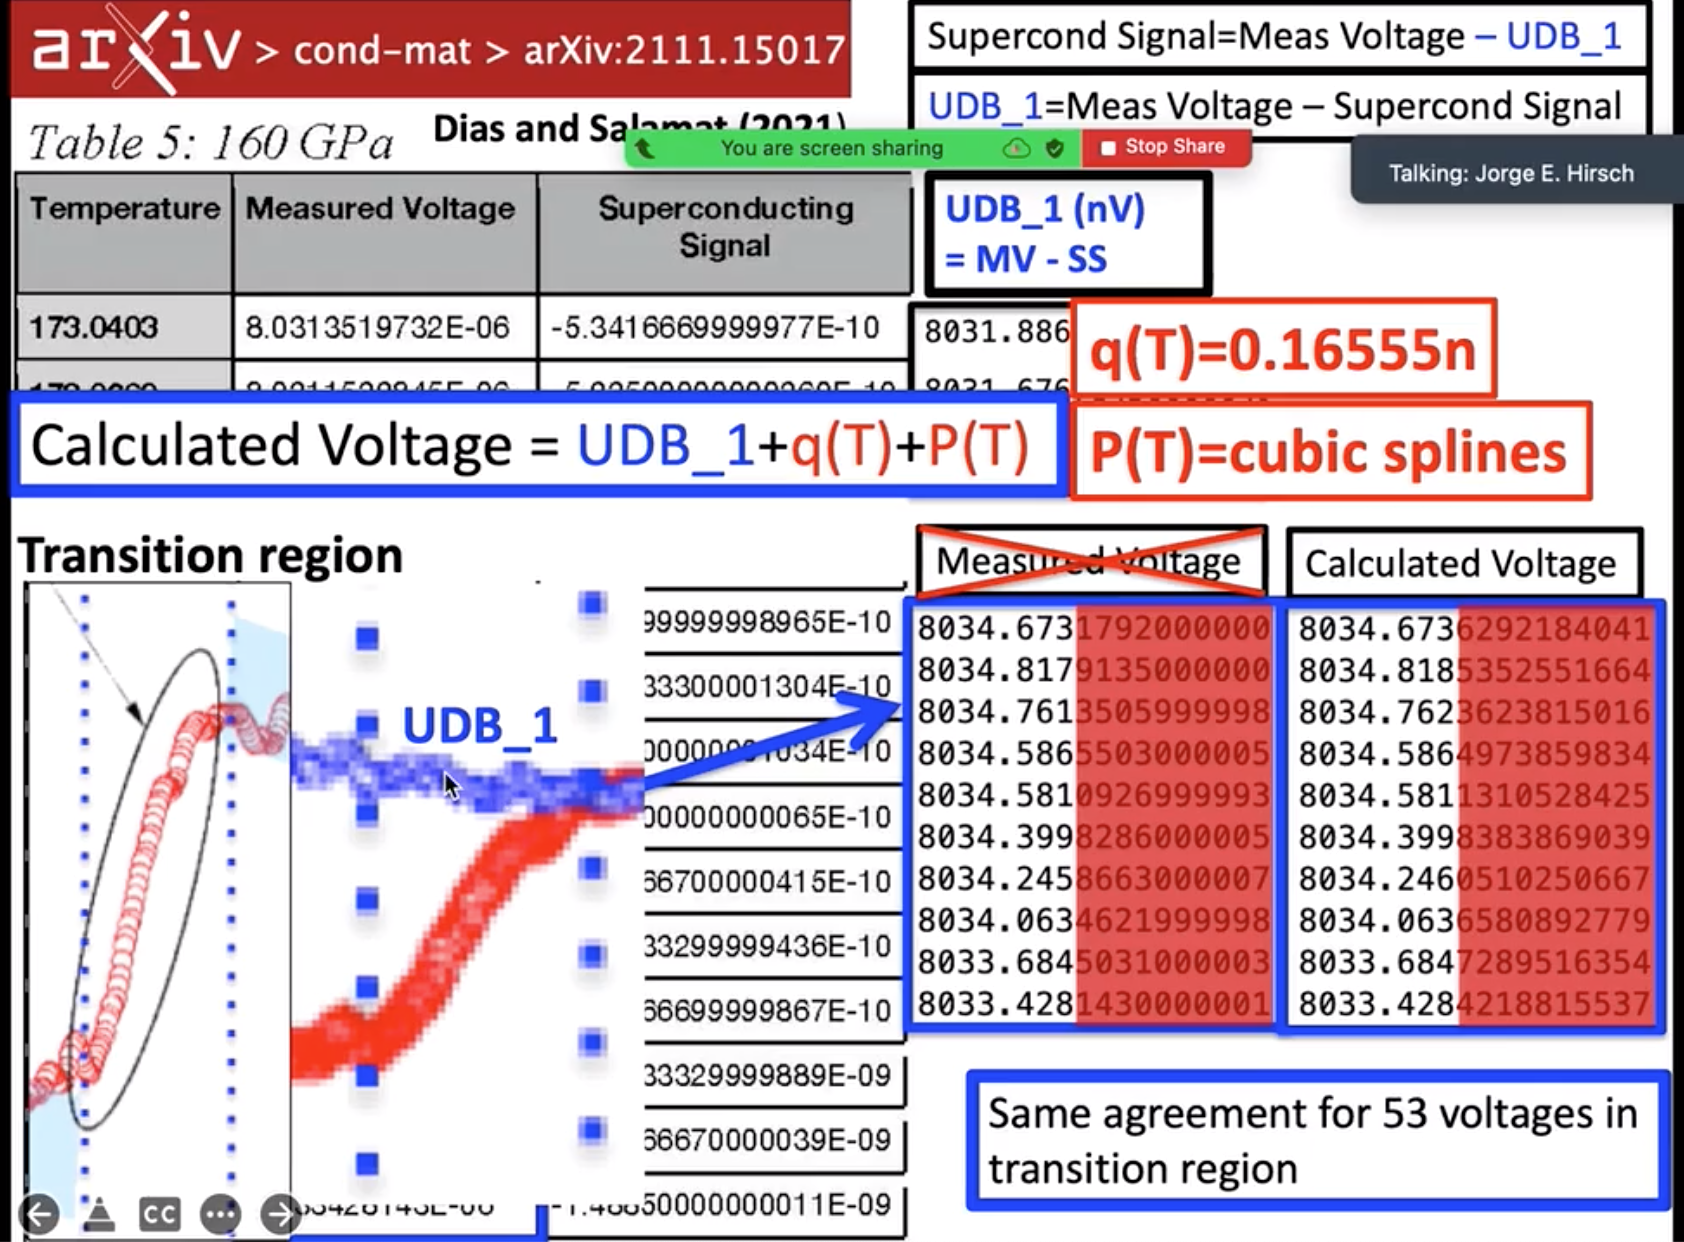
To reproduce yourself the calculations done in that paper, i.e. calculate a voltage that was
supposedly measured and reported as "raw data",
go to this web page.
For an extended in-depth analysis of these issues please see
IJMPB 2375001 (2022), and
MRE 7, 048401 (2022), and
EPL 137 36001 (2022).
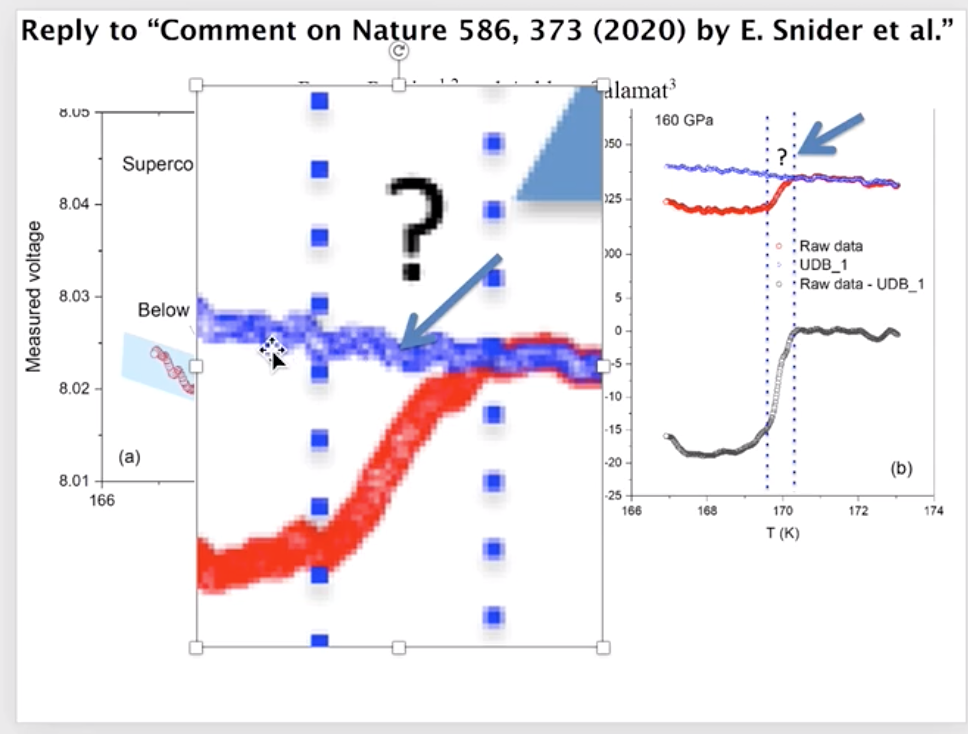
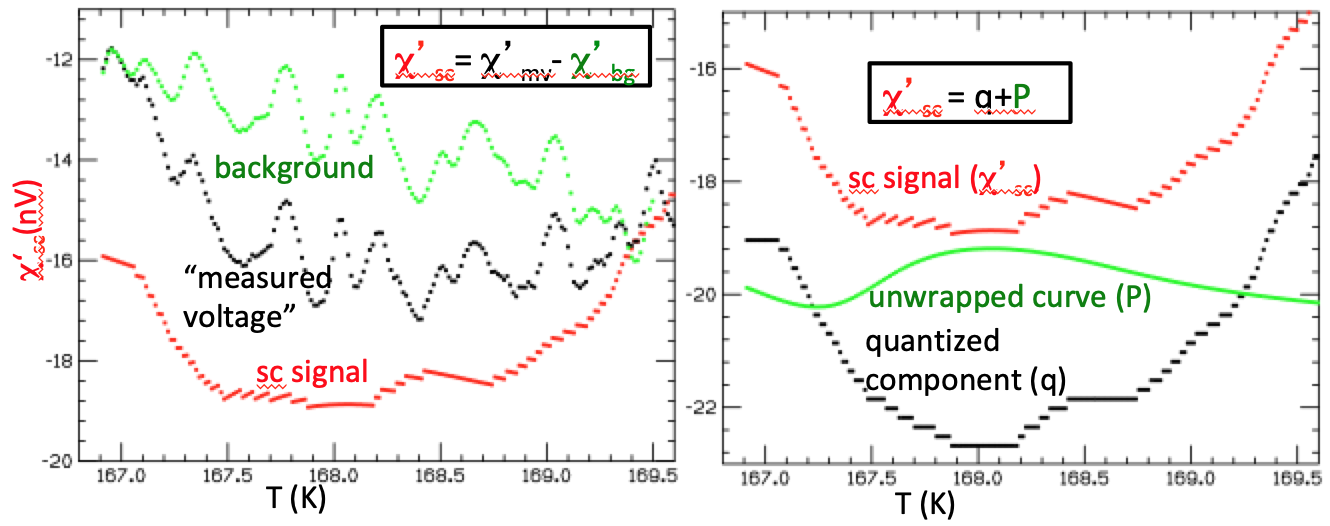
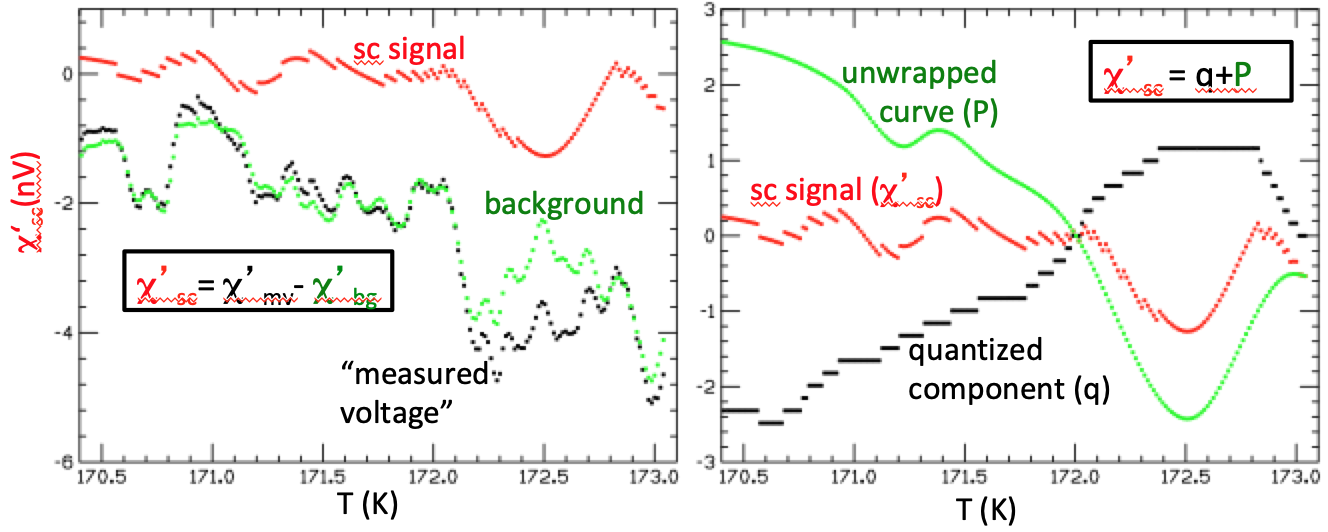
The following images show two decompositions of
the same
superconducting signal
for 160 GPa reported in the
Nature paper.
The left images are reality according to
arXiv:2111.15017,
arXiv:2201.11883v1, the right images are reality according to
IJMPB 2375001 (2022).
It is mathematically impossible that both describe reality.
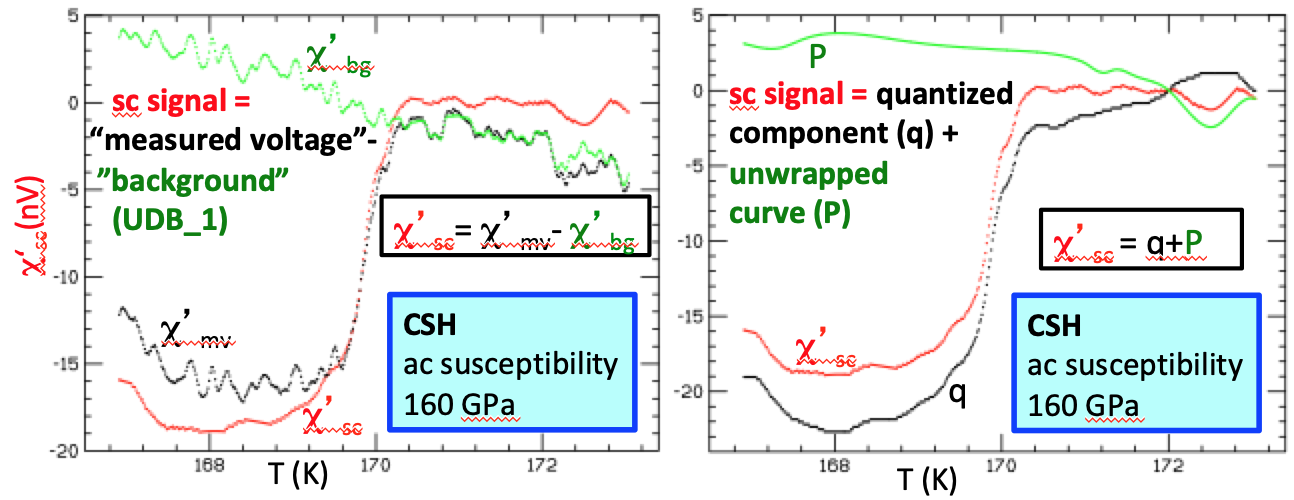
Low temperature parts, amplified
High temperature parts, amplified
>